 [TP1]
Learn
What is a liquidity sweep?
A liquidity sweep is price trading through a prior swing high or swing low, where stop orders rest, and then coming back. Above a high it sweeps buyside liquidity; below a low it sweeps sellside liquidity. This guide explains both, how a sweep differs from a real break, and walks through two examples on NQ.
Buyside and sellside liquidity
Liquidity, in ICT terms, is the orders resting at a price. Above a swing high sit the buy stops of traders who are short and the buy orders of traders waiting for a breakout. That is buyside liquidity (BSL). Below a swing low sit the sell stops of traders who are long and the sell orders of breakout sellers: sellside liquidity (SSL).
The more obvious the level, the more orders tend to rest there. Equal highs and equal lows, two or more swings that stop at the same price, are the clearest pools. So are the highs and lows of the prior day and of each session.
The sweep
A buyside sweep is price trading above a prior swing high, filling the buy stops resting there, and then turning back below it. A sellside sweep is the mirror image: price trades below a prior swing low, fills the sell stops, and turns back above it.
The cleanest sweeps happen on one candle: a wick through the level and a close back inside the range. A sweep can also take a few candles, trading beyond the level for a short while before price returns.
Liquidity sweep vs liquidity grab vs a break
- Liquidity sweep: price takes the orders beyond a high or low and comes back. What matters is the return.
- Liquidity grab: most traders use it for the same thing as a sweep. Some keep it for the sharpest case, a single wick through the level that closes straight back inside, which is the pattern a rejection block is built from.
- A break (a run on liquidity): price takes the level and keeps going, closing beyond it and holding. That isn’t a sweep. The level was a target, not a turning point.
The close is how to tell them apart. A candle that wicks through a level and closes back inside swept it; a candle that closes beyond it broke it.
Liquidity sweep examples
Buyside and sellside sweeps on NQ, 1-minute
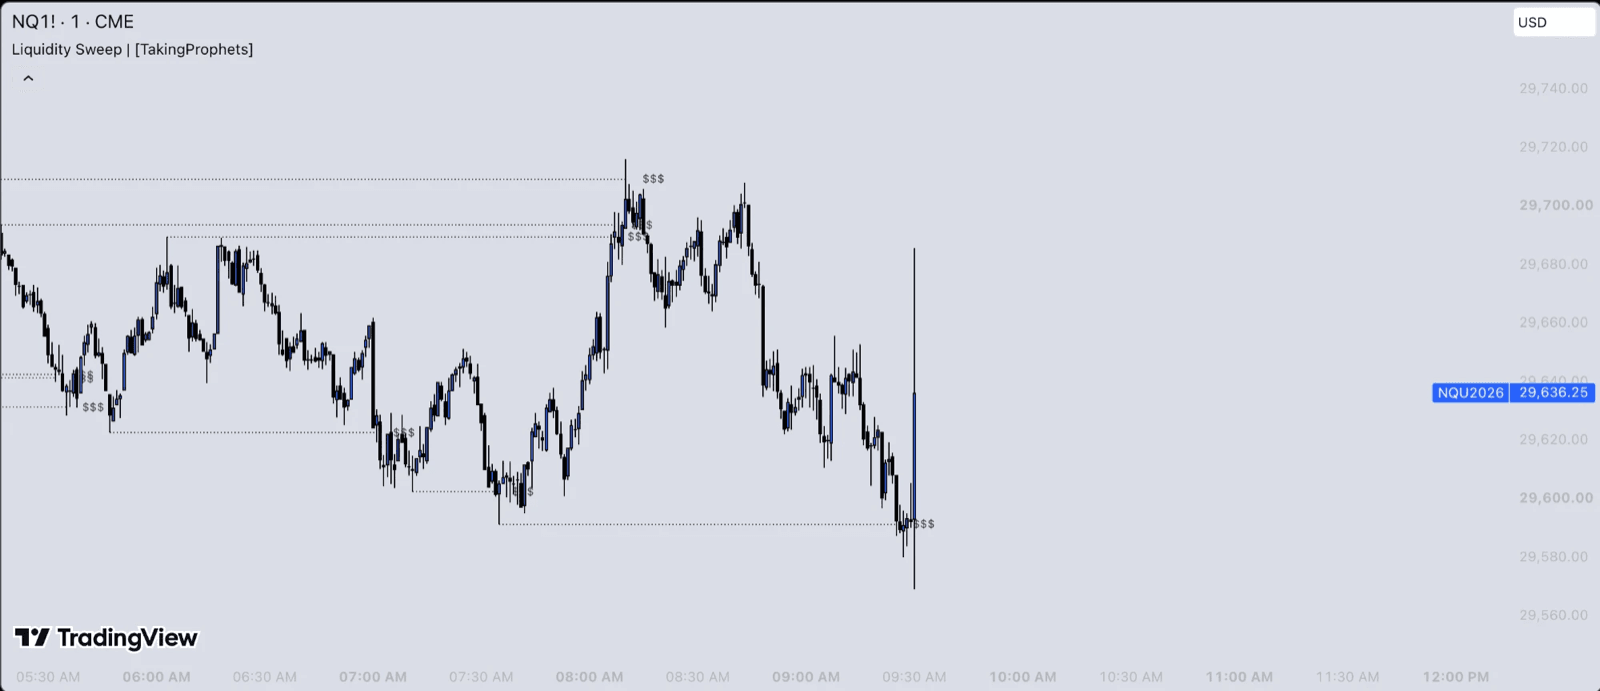
Each dotted line starts at a swing high or low and runs right until price trades through it; the $$$ tag marks where the liquidity was taken. Just after 8:00 a.m. price rallies through the highs left before 6:00, sweeping the buyside liquidity above them, and then fails to hold up there. At the 9:30 open the last candle drops through the swing low from about 7:35, taking the sellside liquidity under it, and trades straight back above it.
A sweep of the London low, then a CISD
On the morning of 12 June 2026, on NQ’s 1-minute chart, price traded below the London session low at 9:45, taking the sellside liquidity resting under it. Delivery then flipped up, and CISD Model+ marked a bullish 1-minute change in state of delivery. The sweep came first; the CISD read the turn that followed it. The CISD Model+ page walks through that chart.
What traders look for after a sweep
In ICT models a sweep is usually the first step, not the whole setup. The 2022 model, as 2022 Model Pro+’s manual describes it, is a liquidity sweep, then a market-structure shift, then a return to an order block or a fair value gap. A change in state of delivery (CISD) is the candle where delivery flips direction after a sweep. Flow State Model Pro+ runs the same idea as an engine: a higher-timeframe level is tapped, liquidity is swept, then a CISD close.
A sweep on its own says that the orders beyond a level were filled. It doesn’t say that price will reverse.
Free indicators that mark liquidity sweeps
- Liquidity Sweep: Tracks higher-timeframe swing highs and lows as buyside and sellside liquidity, and the moment price wicks through one, draws the sweep back to its swing origin.
- Turtle Soup: Marks only the sweeps rejected on the same candle: price wicks through a level and closes back through it. A close beyond the level is a real break, and nothing is drawn.
- Rejection Block Pro+: Turns wick-only sweeps into zones: the wick takes a prior high or low and the body holds back inside the range.
- Equal Highs & Lows: Marks the equal highs and equal lows where liquidity pools, and retires each level once it is taken.
Educational content. A liquidity sweep describes what price did; it doesn’t predict what price will do. Futures trading involves substantial risk of loss. See our risk disclosures.