 [TP1]
Learn
Buy side and sell side liquidity
Buy side liquidity (BSL) is the orders resting above a swing high. Sell side liquidity (SSL) is the orders resting below a swing low. This guide explains where each one collects, why equal highs and equal lows are the clearest pools, how to mark them, and what happens when price reaches them.
What is buy side liquidity?
Above every swing high sit two kinds of orders. Traders who are short keep their protective buy stops just above it, and breakout traders keep buy stop orders there to enter if price goes higher. Both are buy orders waiting at a known price. In ICT terms that is buy side liquidity, written BSL, and also spelled buyside liquidity.
What is sell side liquidity?
Below every swing low it is the mirror image. Traders who are long keep their sell stops just under it, and breakout sellers keep sell stop orders there to enter if price goes lower. That is sell side liquidity, or SSL.
The names describe the orders, not a direction. Buy side liquidity is above price and is made of buy orders; sell side liquidity is below price and is made of sell orders. Neither one says which way price will go next.
Where liquidity rests
The more traders can see a level, the more orders tend to gather beyond it. These are the places ICT traders mark first.
- Swing highs and swing lows. Every confirmed swing high is buy side liquidity and every confirmed swing low is sell side liquidity. A bigger swing is a more important level: ICT Liquidity Levels marks a swing past your Major Level Threshold as a major BSL or SSL, with a thicker line. Marked by ICT Liquidity Levels.
- Equal highs and equal lows. Two or more swings that stop at the same price, or within a small distance of each other, stack their orders in one place. These are the clearest pools on a chart, covered in the next section. Marked by Equal Highs & Lows.
- Session highs and lows. The high and low of the Asia, London, NY AM, NY Lunch and NY PM sessions. Traders mark each one as a level because the stops of everyone who traded that session sit just beyond it. Marked by ICT Killzones + Liquidity.
- Previous day and previous week highs and lows. The prior day's high and low (PDH and PDL) and the prior week's (PWH and PWL) are levels most traders can see, so orders gather beyond them. Marked by ICT Killzones + Liquidity.
- The 8:30 news candle. When the 8:30 a.m. New York candle of a release such as CPI or jobless claims forms a swing high or low, its extreme becomes a level of its own: a DATA.H or DATA.L. Marked by Data Highs & Lows.
Equal highs and equal lows: the clearest pools
When two or more swing highs stop at the same price, the stops behind each of them sit in one place. That is an equal high (EQH), and below price an equal low (EQL). When the swings are close but not identical, ICT calls them relatively equal highs and lows: REQH and REQL. In ICT’s reading these are targets, a draw on liquidity, and the usual question is whether price sweeps the pool, not whether it touches it.
Our free indicators find them in three ways:
- Exact pairs. Two neighboring candles whose highs or lows match to the tick register a level, with no swing strength needed.
- Swing clusters. Swings that land within a tolerance you set are grouped into one level, drawn at the most extreme touch, the price that would actually have to be taken.
- Relative equal levels. Two unswept swing highs or lows within a set distance are flagged, and the outer one is kept as the REQH or REQL.
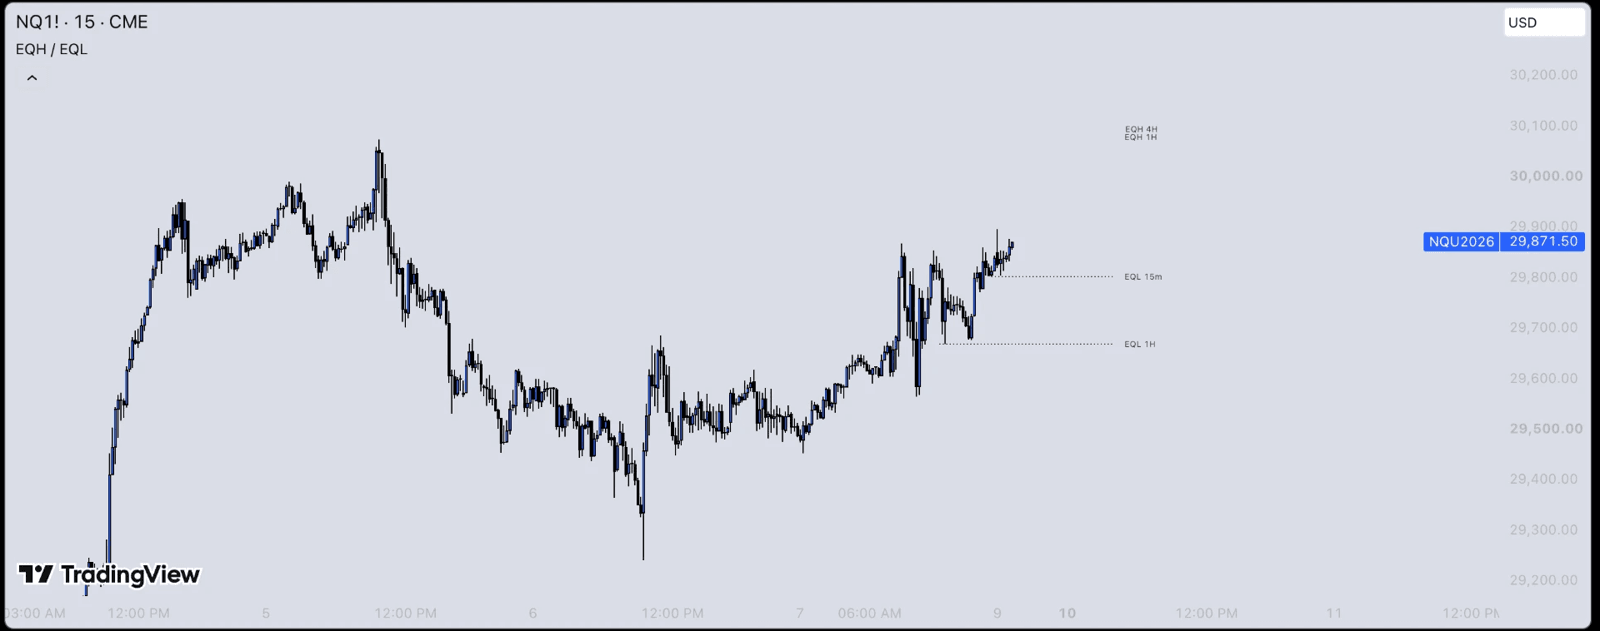
On this chart the buy side pools are the 4H and 1H equal highs above price; the sell side pools are the 15m and 1H equal lows below it. Each label names the timeframe that left the level, so a 4H pool reads differently from one built ten candles ago. A level removes itself once price trades through it, so the chart only shows liquidity that is still resting.
Buy side vs sell side liquidity at a glance
| Buy side liquidity (BSL) | Sell side liquidity (SSL) | |
|---|---|---|
| Where it rests | Above swing highs, equal highs, session and prior day highs | Below swing lows, equal lows, session and prior day lows |
| The orders | Buy stops of shorts, buy stop entries of breakout buyers | Sell stops of longs, sell stop entries of breakout sellers |
| Taken when | Price trades above the high | Price trades below the low |
| Labels you’ll see | BSL, EQH, REQH, PDH, PWH | SSL, EQL, REQL, PDL, PWL |
Draw on liquidity
A draw on liquidity (DOL) is the pool a trader expects price to reach next: the buy side above or the sell side below. Reading it is often the first step of an ICT plan, before any entry.
- Premium and discount. Within a dealing range, from a swing high to a swing low, the upper half is premium and the lower half discount, split at the 50% line (equilibrium). The range high is buy side liquidity and the range low is sell side liquidity.
- A low resistance liquidity run (LRLR). A stretch of price with no defended levels in the way, where price can travel quickly toward the next pool. Our free LRLR indicator marks one in a downtrend: at least four lower swing highs in a row with no bearish fair value gap between them.
- In a model. The Lotion Model keys off an SMT markout and a draw on liquidity, then enters on a linked fair value gap once higher-timeframe bias agrees. SPS Lotion Model+ checks each of those conditions before it flags a setup.
What happens when liquidity is taken
When price trades through a high or a low, the orders resting there are filled. What matters next is the close:
- A sweep. Price wicks through the level and closes back on the other side. The stops were taken, but the level didn’t break. The liquidity sweep guide covers it with examples, and the free Turtle Soup indicator marks only sweeps rejected on the same candle.
- A run. Price closes beyond the level and holds. The pool was a target, not a turning point, and the next pool beyond it becomes the draw.
In ICT models a sweep is usually where a setup starts, not the whole of it. After a buy side sweep, a bearish change in state of delivery (CISD) is a close below the open of the sequence that made the sweep; after a sell side sweep, a bullish CISD is a close above it. The smart money concepts guide shows how liquidity fits with market structure, order blocks and fair value gaps.
A level that has been taken is no longer resting liquidity. That is why our indicators remove a level, or fade it, once price trades through it.
Questions
Is buy side liquidity bullish?
No. Buy side liquidity is a place on the chart, above a high, not a signal. Price trading up into it fills the buy stops there; whether price then keeps going or turns is what the close beyond the level shows.
Is it buyside or buy side liquidity?
Both spellings mean the same thing, and so do sellside and sell side. They are shortened to BSL and SSL on charts.
What does EQH mean in trading?
EQH means equal highs: two or more highs at the same price, with buy side liquidity resting above them. EQL, equal lows, is the same below price with sell side liquidity under it.
Free indicators that mark buy side and sell side liquidity
- ICT Liquidity Levels: Swing highs as BSL and swing lows as SSL, major levels flagged, close levels merged and relabeled REQH or REQL. Free and open-source.
- Equal Highs & Lows: Exact tick pairs and swing clusters, with the 4H, 1H and 15m pools drawn on any chart and each level retired once it is swept.
- REQH/L: Only the relative equal highs and lows: two unswept swing highs or lows within a set distance.
- ICT Killzones + Liquidity: Every session high and low as a liquidity level, plus the previous day and week highs and lows.
- Data Highs & Lows: The level left by an 8:30 a.m. New York news candle that forms a swing high or low.
- Liquidity Sweep: Higher-timeframe swing highs and lows as buy side and sell side liquidity, and the sweep when price wicks through one.
Educational content. Liquidity levels describe where orders may rest; they don’t predict what price will do. Futures trading involves substantial risk of loss. See our risk disclosures.