 [TP1]
Learn
What is SMT divergence?
SMT divergence is when two markets that usually move together disagree at a high or a low. One of them takes the level, and the other fails to. SMT stands for smart money technique, a term from ICT’s teaching. This guide shows how a divergence forms, bullish and bearish SMT, which markets are paired, and when an SMT stops counting.
How SMT divergence forms
Some markets are closely correlated: the Nasdaq 100 and S&P 500 futures (NQ and ES), or gold and silver. Most of the time, when one makes a new high, so does the other. Their swing highs and lows are liquidity: stops and orders rest beyond them.
An SMT divergence is the moment they disagree at one of those levels. Price runs above an earlier high on one chart, but the correlated chart stays below its own matching high. ICT traders read the market that failed as the tell: the run on the other chart took liquidity without the move being confirmed across the pair.
Bullish and bearish SMT
- Bearish SMT: at a swing high, one market makes a higher high while the correlated market makes a lower high. The high that was not taken is the divergence.
- Bullish SMT: at a swing low, one market makes a lower low while the correlated market makes a higher low. The low that held is the divergence.
Either way it takes both halves. If both markets make a higher high, or both a lower low, that is correlation, the opposite of a divergence. A divergence needs one market to fail where the other succeeded.
Reading it correctly
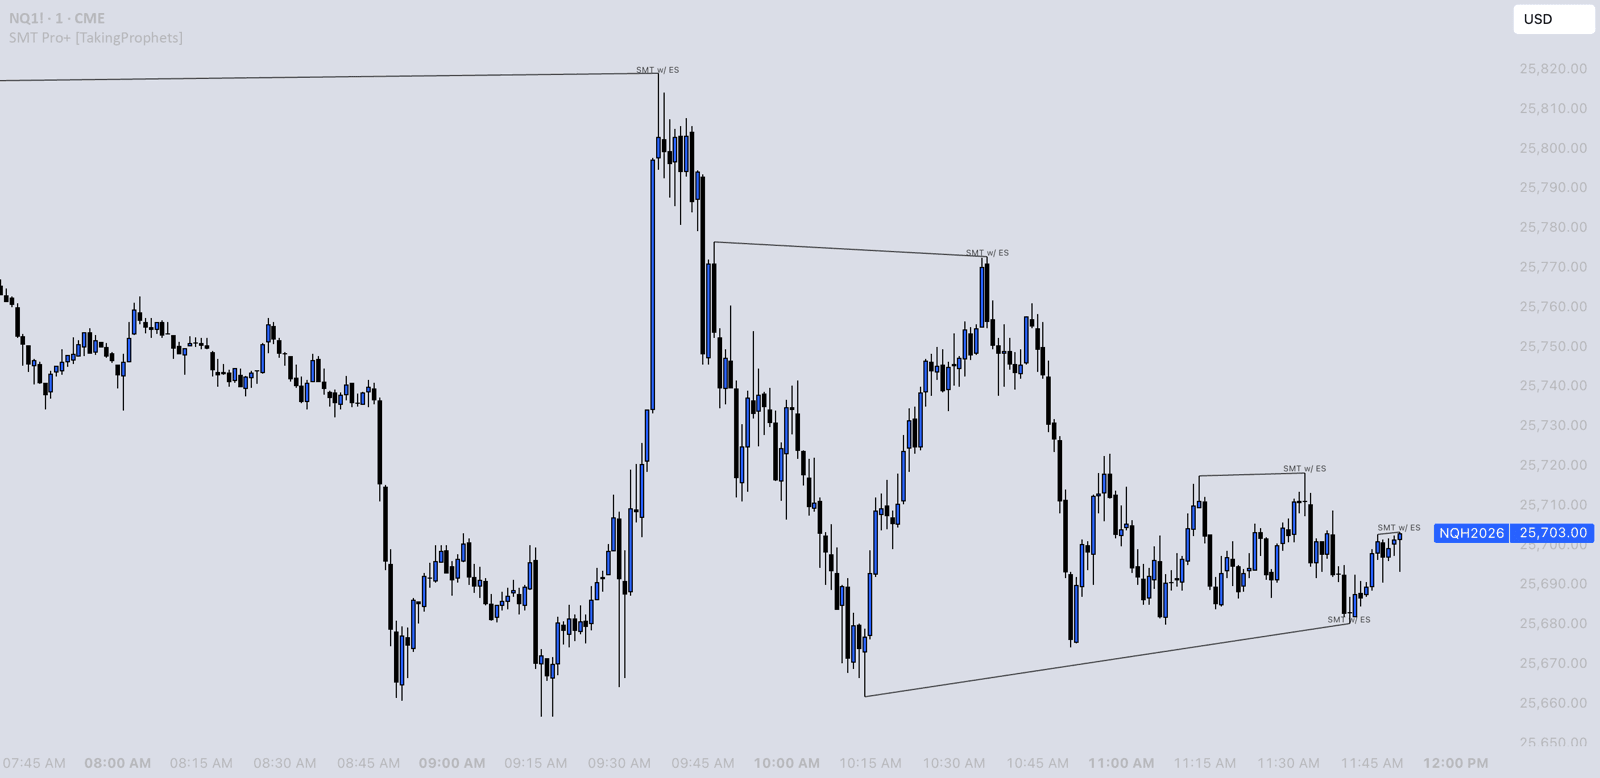
Swing to swing, not bar to bar. An SMT compares each market with its own previous swing high or low, at the same point in time on both charts. Comparing one candle with the one before it marks noise as divergence, and so does comparing one chart’s swing with whatever the other chart is doing now.
Levels both charts made. Eyeballing two charts side by side, it’s easy to pair swings that only look close. SMT Pro+ is stricter: a level qualifies only when the pivot forms and confirms on your symbol and on the correlated one on the same bar, and the divergence triggers when exactly one of the two takes that level.
Live or confirmed. While price is still pushing, the divergence can trail to new extremes. Some traders watch it live; others wait until the swing has confirmed. SMT Pro+ does either, with one toggle.
When an SMT stops counting
A divergence can be undone. If the lagging market goes on to take its level too, both markets have swept it and there is no longer any disagreement. And a confirmed SMT whose own extreme is later broken no longer marks a failed high or low. SMT Pro+ removes the mark in both cases, so the ones left on the chart are the ones that still hold.
Which markets are paired
An SMT needs two markets that normally move together. Common pairs:
- Index futures: NQ against ES, MNQ against MES, and NQ, ES and YM as a group of three.
- Metals: gold against silver (GC against SI), and GC, SI and HG as a group of three.
- Forex: EURUSD, GBPUSD and the dollar index (DXY).
The dollar index moves against EURUSD and GBPUSD, so against it the comparison is mirrored: a high on one market is matched with a low on the other.
SMT, SSMT and PSP
Sequential SMT (SSMT) reads the divergence inside time cycles. In True CISD, within Quarterly Theory cycles, an SSMT forms when one market in a group of three takes the previous quarter’s high or low and another does not. The indicator then finds the run of candles that delivered price into that swing and marks the level a candle must close through to confirm a change in state of delivery.
Precision Swing Points (PSP) look at the candles themselves: a PSP is the middle candle of a three-candle swing where this market and its correlated market close in opposite directions. The free PSP indicator tags one that also forms an SMT divergence.
SMT in entry models
On its own, an SMT says two markets disagreed at a level. Models use it as one condition among several, beside a liquidity sweep, an inverse fair value gap or a change in state of delivery. Our guide to ICT trading shows how the concepts fit together.
- Motion Model+: An external SMT divergence arms a swing, an internal SMT at that swing's price confirms it, and the first inversion fair value gap in the same direction within ten minutes marks the entry.
- Flow State Model Pro+: Its second engine looks for an aligned CRT with a directional SMT at the CISD leg.
- CISD Model+: Marks CISDs on several timeframes and detects and alerts SMT divergence between correlated markets beside them.
- Quadz Pro+: Draws SMT divergence beside OTE zones, rejection blocks and killzones, for confluence such as an OTE retracement into a rejection block during a killzone, confirmed by SMT.
Before risking money on any model, you can replay it on real history in the Backtester and see how it behaved.
Free indicators that mark it
- SMT Pro+: Pairs a liquidity level only when it forms on your symbol and the correlated one on the same bar, then marks the divergence when exactly one of them sweeps it. NQ against ES, MNQ against MES and GC against SI are built in.
- True CISD: Tracks a Sequential SMT across a correlated triad within Quarterly Theory cycles, then the True CISD level, confirmed only on a candle close.
- PSP: Finds Precision Swing Points on higher timeframes, where this market and its correlated market close in opposite directions at a swing, and tags one that also forms an SMT.
- Standard Deviations: Projects deviation levels from each completed swing leg, and can draw only the sets an SMT or SSMT divergence anchors.
Educational content. An SMT divergence describes what two markets did; it doesn’t predict what price will do. Futures trading involves substantial risk of loss. See our risk disclosures.