 [TP1]
Learn
What is turtle soup in trading?
Turtle soup is a false break. Price trades through a prior swing high or swing low, takes the stop orders resting beyond it, fails to hold, and closes back through the level. This guide explains the bullish and bearish versions, how the close separates turtle soup from a real breakout, where the levels come from, and what one looks like on an NQ chart.
Turtle soup, defined
Above a swing high rest the buy stops of traders who are short and the buy orders of traders waiting for a breakout: buyside liquidity. Below a swing low rest sell stops and breakout sell orders: sellside liquidity. A break of the level fills those orders.
In a turtle soup the break doesn’t hold. Price sweeps the buyside or sellside liquidity and is rejected on the same candle: the wick goes through the level and the candle closes back through it. The traders who bought the breakout of the high, or sold the breakdown of the low, are now on the wrong side of the level.
The free Turtle Soup indicator uses exactly that rule. A level is marked only when price wicks through it and closes back through it on that candle, and the mark is confirmed on the closed bar, not while the candle is still forming.
Bullish and bearish turtle soup
- Bearish turtle soup: price wicks above a prior swing high, taking the buyside liquidity, and the same candle closes back below the high.
- Bullish turtle soup: price wicks below a prior swing low, taking the sellside liquidity, and the same candle closes back above the low.
The names describe the rejection, not the level. A bearish turtle soup happens at a high, and a bullish one at a low.
Turtle soup vs a real breakout
The close decides it. A candle that wicks through a level and closes back inside the range is a turtle soup. A candle that closes beyond the level is a genuine break: the level was a target, and price kept going. That is why the Turtle Soup indicator draws nothing when a sweep closes beyond the level. Only the failed breaks, liquidity taken and rejected, are marked.
A turtle soup can fail too. If price later closes back through the swept level, the rejection didn’t hold, and the indicator removes that mark. Only the most recent markers stay on the chart.
Turtle soup vs a liquidity sweep vs a rejection block
- Liquidity sweep: any move that takes the stops beyond a high or low and comes back, on one candle or over a few. See what a liquidity sweep is.
- Turtle soup: the one-candle version. The same candle that takes the level closes back through it.
- Rejection block: the zone that candle leaves. Its wick is marked, and traders watch it when price comes back. See what a rejection block is.
So one candle can be all three: a sweep of a high, a turtle soup because it closed back below, and a rejection block in the wick it left.
Where the levels come from
Turtle soup needs a level with orders behind it. The usual ones are prior swing highs and lows, equal highs and equal lows, the highs and lows of each session and of the prior day, and the same levels on higher timeframes. Buy side and sell side liquidity walks through where those orders rest.
Higher-timeframe levels matter because more traders can see them. The Turtle Soup indicator scans the chart timeframe plus up to five higher timeframes. Each one confirms on its own close and is tagged, so a sweep of a 1-hour low is never confused with a sweep of a 1-minute one.
Turtle soup on a chart: NQ, 1-minute
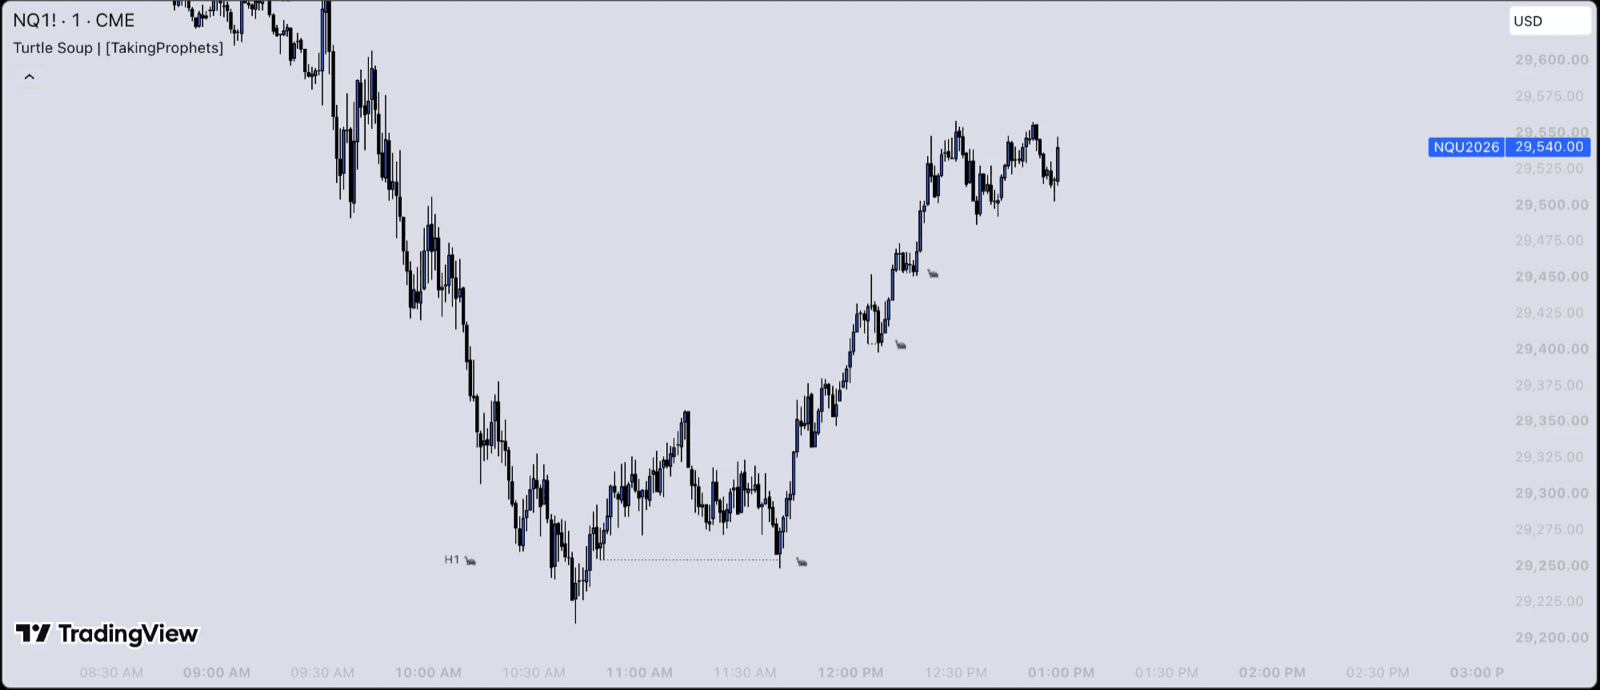
Each turtle marks a level that price swept and rejected on the same candle. The dotted line runs from the low that was taken to the candle that took it, and the H1 tag says the swept level came from the 1-hour chart. Lows that price broke and closed below get no turtle.
What traders look for after a turtle soup
In ICT models a sweep is usually the first step, not the whole setup. Traders then look for a change in state of delivery (CISD), the candle where delivery flips direction after the sweep. The CISD Model+ page walks through one on NQ: a sweep of the London low at 9:45, then a bullish 1-minute CISD.
A turtle soup on its own says that the orders beyond a level were filled and the candle closed back inside. It doesn’t say that price will reverse.
Turtle soup questions
Is turtle soup bullish or bearish?
Either. At a swing high it is bearish (buyside liquidity taken, close back below). At a swing low it is bullish (sellside liquidity taken, close back above).
Is turtle soup an ICT concept?
ICT traders use the name for the false break of a prior high or low that traps breakout traders, and treat it as a liquidity pattern: the stops beyond the level are the reason price went there.
Does the Turtle Soup indicator mark a level while the candle is open?
No. Each mark is confirmed on the closed bar, on the chart timeframe and on each higher timeframe it scans.
Free indicators that mark turtle soup and liquidity
- Turtle Soup: Marks the false break: a sweep of buyside or sellside liquidity rejected on the same candle, on the chart timeframe and up to five higher ones, with session-window alerts.
- Liquidity Sweep: Tracks higher-timeframe swing highs and lows as buyside and sellside liquidity, and draws each sweep back to its swing origin.
- Rejection Block Pro+: Turns wick-only sweeps into zones: the wick takes a prior high or low and the body holds back inside the range.
- Equal Highs & Lows: Marks the equal highs and equal lows where liquidity pools, and retires each level once it is taken.
Educational content. A turtle soup describes what price did; it doesn’t predict what price will do. Futures trading involves substantial risk of loss. See our risk disclosures.